• Home
  • Strategies
  • VPS
  • Education
    • Trading Basics
      • Forex Basics
      • Who Trades Forex and Why?
      • Learn to Trade
    • Top Cryptocurrencies
      • What is Cryptocurrency?
      • The Major Cryptocurrencies Traded Globally
      • Cryptocurrency Liquidity
      • Cryptocurrency Trading Strategies
      • Basic Understanding of Bitcoin
      • Basic Understanding of Ethereum and Its Currency Ether
  • About Us
  • Contact
  • FAQ
  • Glossary
ETHMXN Skyrockets
July 22, 2020
Would the US Dollar Rise Again?
July 22, 2020

British Pound Possible Downtrend

Published by TradersColo at July 22, 2020
Categories
  • forex
Tags
  • chart patterns
  • gbpmxn
  • technical indicators
  • trend analysis
gbpmxn daily chart

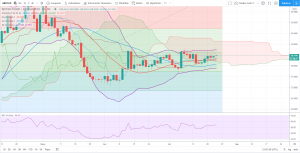
GBPMXN CHART PRICE – GBPMXN DAILY

For most of the month of June we have seen GBPMXN trade within the 27.73 and 28.74 range which is more than 1,000 pips, right now the price is at 28.48 and its currently trading inside the Ichimoku Cloud, which can be interpreted as market uncertainty, but looking at the previous behaviour of the price we believe that very soon it will start its decline, we don’t see this pair trading outside these range on the short term, the Bollinger bands are wide and steady, so we can expect price changes when the British and Mexican markets reopen. The moving averages still indicate an uptrend, I see this uptrend lasting a few more hours, maybe days, but once it reaches 28.74 we would predict that it would start dropping. Stay alert on this pair as there might be a good trading opportunity to go short very soon. When the RSI reaches more than 58% then I would check my indicators again and make a trading decision that would very likely be a short trade, once GBPMXN trades at 28.74 or close I see an opportunity to trade.

This post does not provide Financial Advice for traders, its merely purpose is education, use all the information available from different Analysts and build your own strategy, trading is not for everyone, you should only trade with money you can afford to lose, past performance is not an indicator of future results.

Share
0
TradersColo
TradersColo

Related posts

October 9, 2020

GBPMXN Breaks Support at 26.67


Read more
eurmxn-traderscolo
October 9, 2020

EURMXN Tests Resistance at 25.18


Read more
October 8, 2020

USDMXN Continues Downtrend


Read more

Leave a Reply Cancel reply

Your email address will not be published. Required fields are marked *

Search Strategies

Browse by Asset Class

  • commodities
  • cryptocurrency
  • debt
  • energy
  • equities
  • forex
  • indices
  • precious metals

Recent Articles

  • 0
    GBPMXN Breaks Support at 26.67
    October 9, 2020
  • eurmxn-traderscolo0
    EURMXN Tests Resistance at 25.18
    October 9, 2020
  • 0
    USDMXN Continues Downtrend
    October 8, 2020
  • 0
    BTCUSD Low Volatility
    October 8, 2020
  • 0
    ETHUSD Unable To Break Resistance at 351.48
    October 7, 2020
  • 0
    LTCUSD Low Volatility
    October 7, 2020

Follow Us for Real Time Updates From Our Analysts

  • Facebook
  • Instagram
  • Twitter

Cookies

Privacy Policy

Risk Disclosure

Terms of Use

Follow TradersColo

© 2020 Traderscolo. All Rights Reserved.