• Home
  • Strategies
  • VPS
  • Education
    • Trading Basics
      • Forex Basics
      • Who Trades Forex and Why?
      • Learn to Trade
    • Top Cryptocurrencies
      • What is Cryptocurrency?
      • The Major Cryptocurrencies Traded Globally
      • Cryptocurrency Liquidity
      • Cryptocurrency Trading Strategies
      • Basic Understanding of Bitcoin
      • Basic Understanding of Ethereum and Its Currency Ether
  • About Us
  • Contact
  • FAQ
  • Glossary
Unstable Dash
July 20, 2020
EURUSD Is Ready to Change Direction, Prepare to Short
July 20, 2020

EURGBP Technical Outlook

Published by TradersColo at July 20, 2020
Categories
  • forex
Tags
  • chart patterns
  • dash
  • technical indicators
  • trend analysis
eurgbp 4h chart

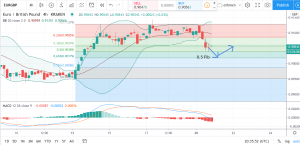
EURGBP CHART PRICE – EURGBP 4H

What do you think of the fluctuation after the upward trend I marked?

Is that confusing?

The situation now is a little bit tricky. I do not observe a clear trend for the long term. So I would like to see a short term trend. 

Let’s just focus on the recent upward movement first. 

The price goes up and fluctuates at this level for a while, so I mark the upward movement with the Fibonacci Retracement. 

Then, The latest price already breakout from the Bollinger Bands. As can be seen, the Bollinger Bands form a trumpet-shaped form, which means the price would be more volatile. Although the price always backs out to the middle of the Bollinger Bands, I still consider the sale pressure is stronger. Then when would be the point for changing the direction of the trend? I expect the price retrace to the 0.618 level, which means the price would continue to go down for a while. 

In conclusion, I would expect the price to go down to the 0.618 fib level, which is 0.90180. Then go back to meet the middle line of the Bollinger Bands, which might be at 0.90532.

This post does not provide Financial Advice for traders, its merely purpose is education, use all the information available from different Analysts and build your own strategy, trading is not for everyone, you should only trade with money you can afford to lose, past performance is not an indicator of future results.

Share
0
TradersColo
TradersColo

Related posts

October 9, 2020

GBPMXN Breaks Support at 26.67


Read more
eurmxn-traderscolo
October 9, 2020

EURMXN Tests Resistance at 25.18


Read more
October 8, 2020

USDMXN Continues Downtrend


Read more

Leave a Reply Cancel reply

Your email address will not be published. Required fields are marked *

Search Strategies

Browse by Asset Class

  • commodities
  • cryptocurrency
  • debt
  • energy
  • equities
  • forex
  • indices
  • precious metals

Recent Articles

  • 0
    GBPMXN Breaks Support at 26.67
    October 9, 2020
  • eurmxn-traderscolo0
    EURMXN Tests Resistance at 25.18
    October 9, 2020
  • 0
    USDMXN Continues Downtrend
    October 8, 2020
  • 0
    BTCUSD Low Volatility
    October 8, 2020
  • 0
    ETHUSD Unable To Break Resistance at 351.48
    October 7, 2020
  • 0
    LTCUSD Low Volatility
    October 7, 2020

Follow Us for Real Time Updates From Our Analysts

  • Facebook
  • Instagram
  • Twitter

Cookies

Privacy Policy

Risk Disclosure

Terms of Use

Follow TradersColo

© 2012 - 2021 Traderscolo. All Rights Reserved.