• Home
  • Strategies
  • VPS
  • Education
    • Trading Basics
      • Forex Basics
      • Who Trades Forex and Why?
      • Learn to Trade
    • Top Cryptocurrencies
      • What is Cryptocurrency?
      • The Major Cryptocurrencies Traded Globally
      • Cryptocurrency Liquidity
      • Cryptocurrency Trading Strategies
      • Basic Understanding of Bitcoin
      • Basic Understanding of Ethereum and Its Currency Ether
  • About Us
  • Contact
  • FAQ
  • Glossary
eurmxn-traderscolo
Going Down? Is This What You Expect on EURMXN?
July 22, 2020
USDMXN Undecided
July 23, 2020

Fib + Wedge Pattern = Brent Oil!!!

Published by TradersColo at July 23, 2020
Categories
  • energy
Tags
  • chart patterns
  • technical indicators
  • trend analysis
  • wtiusd
wtiusd daily chart

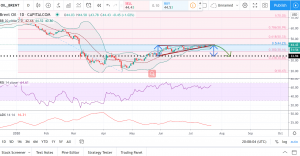
WTIUSD CHART PRICE – WTIUSD DAILY

How do you feel about my chart?

I would love to have this pattern here because the reversal signal is clear to me. First, 0.5 level fib line is also a trend line for me. From the pattern, we can see that the price forms a rising wedge pattern, the 0.5 level fib line is the upper trend line. So, the sale pressure from the fib line could be hard. Also, the rising wedge pattern is a downward trend signal. The ADX is low because the trend now is not strong. The price is tired, every growth is less than before. Another signal is RSI, which is comparatively high.

For all the signals we have, let’s wait for the downward trend. 

This post does not provide Financial Advice for traders, its merely purpose is education, use all the information available from different Analysts and build your own strategy, trading is not for everyone, you should only trade with money you can afford to lose, past performance is not an indicator of future results.

Share
1
TradersColo
TradersColo

Leave a Reply Cancel reply

Your email address will not be published. Required fields are marked *

Search Strategies

Browse by Asset Class

  • commodities
  • cryptocurrency
  • debt
  • energy
  • equities
  • forex
  • indices
  • precious metals

Recent Articles

  • 0
    GBPMXN Breaks Support at 26.67
    October 9, 2020
  • eurmxn-traderscolo0
    EURMXN Tests Resistance at 25.18
    October 9, 2020
  • 0
    USDMXN Continues Downtrend
    October 8, 2020
  • 0
    BTCUSD Low Volatility
    October 8, 2020
  • 0
    ETHUSD Unable To Break Resistance at 351.48
    October 7, 2020
  • 0
    LTCUSD Low Volatility
    October 7, 2020

Follow Us for Real Time Updates From Our Analysts

  • Facebook
  • Instagram
  • Twitter

Cookies

Privacy Policy

Risk Disclosure

Terms of Use

Follow TradersColo

© 2012 - 2021 Traderscolo. All Rights Reserved.