• Home
  • Strategies
  • VPS
  • Education
    • Trading Basics
      • Forex Basics
      • Who Trades Forex and Why?
      • Learn to Trade
    • Top Cryptocurrencies
      • What is Cryptocurrency?
      • The Major Cryptocurrencies Traded Globally
      • Cryptocurrency Liquidity
      • Cryptocurrency Trading Strategies
      • Basic Understanding of Bitcoin
      • Basic Understanding of Ethereum and Its Currency Ether
  • About Us
  • Contact
  • FAQ
  • Glossary
ETHMXN Tests Resistance at 5530
July 10, 2020
Next Target for USDJPY
July 10, 2020

MXN Getting Closer to Support

Published by TradersColo at July 10, 2020
Categories
  • forex
Tags
  • chart patterns
  • technical indicators
  • trend analysis
usdmxn daily chart

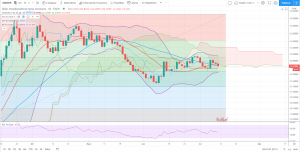
USDMXN CHART PRICE – USDMXN DAILY

USD has lost some ground in the last 3 days against the MXN, it did not reach its resistance level before it started to drop, there has been a lot of activity in this pair, just today it started the day with gains but currently it sits at 22.47, almost 400 pips less than the highest it reached just today, the Relative Strength Index has been dropping as well in the last 3 days which is only natural, the client sentiment changed and we find the RSI at 46%, moving averages indicate a downtrend but the price is currently trading below the Ichimoku cloud, these are mixed signals, but watching the RSI and how close the price is from reaching its resistance I believe that the mexican Peso will get stronger in the next few days, there are some fundamentals that support our theory, on Wednesday Mexican president visited the US and the meetings with th US president seem to have gone very well, we definitely see the price going as low as 22.16 but we normally set the Take Profits at 80% of the difference between the resistance and the support.

This post does not provide Financial Advice for traders, its merely purpose is education, use all the information available from different Analysts and build your own strategy, trading is not for everyone, you should only trade with money you can afford to lose, past performance is not an indicator of future results.

Share
1
TradersColo
TradersColo

Related posts

October 9, 2020

GBPMXN Breaks Support at 26.67


Read more
eurmxn-traderscolo
October 9, 2020

EURMXN Tests Resistance at 25.18


Read more
October 8, 2020

USDMXN Continues Downtrend


Read more

Leave a Reply Cancel reply

Your email address will not be published. Required fields are marked *

Search Strategies

Browse by Asset Class

  • commodities
  • cryptocurrency
  • debt
  • energy
  • equities
  • forex
  • indices
  • precious metals

Recent Articles

  • 0
    GBPMXN Breaks Support at 26.67
    October 9, 2020
  • eurmxn-traderscolo0
    EURMXN Tests Resistance at 25.18
    October 9, 2020
  • 0
    USDMXN Continues Downtrend
    October 8, 2020
  • 0
    BTCUSD Low Volatility
    October 8, 2020
  • 0
    ETHUSD Unable To Break Resistance at 351.48
    October 7, 2020
  • 0
    LTCUSD Low Volatility
    October 7, 2020

Follow Us for Real Time Updates From Our Analysts

  • Facebook
  • Instagram
  • Twitter

Cookies

Privacy Policy

Risk Disclosure

Terms of Use

Follow TradersColo

© 2012 - 2021 Traderscolo. All Rights Reserved.