• Home
  • Strategies
  • VPS
  • Education
    • Trading Basics
      • Forex Basics
      • Who Trades Forex and Why?
      • Learn to Trade
    • Top Cryptocurrencies
      • What is Cryptocurrency?
      • The Major Cryptocurrencies Traded Globally
      • Cryptocurrency Liquidity
      • Cryptocurrency Trading Strategies
      • Basic Understanding of Bitcoin
      • Basic Understanding of Ethereum and Its Currency Ether
  • About Us
  • Contact
  • FAQ
  • Glossary
MXN Getting Closer to Support
July 10, 2020
HSI Technical Analysis
July 13, 2020

Next Target for USDJPY

Published by TradersColo at July 10, 2020
Categories
  • forex
Tags
  • chart patterns
  • technical indicators
  • trend analysis
  • usdjpy
usdjpy daily chart

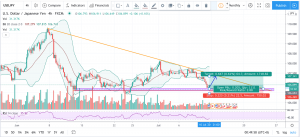
USDJPY CHART PRICE – ETHMXN DAILY

From the 4 hour chart, a clear two-months bearish triangle pattern can be identified on USDJPY. The price has been descending crawling on the lower band of the Bollinger Band. However, it has stopped at 106, and buying power has tried to stop the downtrend and push up the price from the lower bound of the triangle pattern, which is the support line. The Bollinger band’s width has started to decrease from its expansion, indicating that the slow down of its great volatility and also the price is likely to tend to rebound. 

As can be seen from the Relative Strength Index, the USDJPY has reached a low oversold level of 30%, then has gone up a few points in today’s trading session as the pair had small gains. This shows the energy of continued decline is slightly insufficient, and the buying power is pushing up and trying to stop the price from breaking up the support level. 

I expect the USDJPY to go up and retest the resistance level at 107. However, if the price continues to drop below the price of 106.5, it will break out the support level and continue its downward trend. 

The upper resistance level we need to pay attention to is 107.

The lower support level we need to pay attention to is 106.5.

This post does not provide Financial Advice for traders, its merely purpose is education, use all the information available from different Analysts and build your own strategy, trading is not for everyone, you should only trade with money you can afford to lose, past performance is not an indicator of future results.

Share
0
TradersColo
TradersColo

Related posts

October 9, 2020

GBPMXN Breaks Support at 26.67


Read more
eurmxn-traderscolo
October 9, 2020

EURMXN Tests Resistance at 25.18


Read more
October 8, 2020

USDMXN Continues Downtrend


Read more

Leave a Reply Cancel reply

Your email address will not be published. Required fields are marked *

Search Strategies

Browse by Asset Class

  • commodities
  • cryptocurrency
  • debt
  • energy
  • equities
  • forex
  • indices
  • precious metals

Recent Articles

  • 0
    GBPMXN Breaks Support at 26.67
    October 9, 2020
  • eurmxn-traderscolo0
    EURMXN Tests Resistance at 25.18
    October 9, 2020
  • 0
    USDMXN Continues Downtrend
    October 8, 2020
  • 0
    BTCUSD Low Volatility
    October 8, 2020
  • 0
    ETHUSD Unable To Break Resistance at 351.48
    October 7, 2020
  • 0
    LTCUSD Low Volatility
    October 7, 2020

Follow Us for Real Time Updates From Our Analysts

  • Facebook
  • Instagram
  • Twitter

Cookies

Privacy Policy

Risk Disclosure

Terms of Use

Follow TradersColo

© 2012 - 2021 Traderscolo. All Rights Reserved.